
In the last couple of years we have experienced record-breaking extreme weather. In terms of lives lost and property damaged, floods are among the most . No matter what type of flooding occurs, in most cases it leaves devastating consequences. To assess the damages experts use different approaches, among which the use of is becoming more and more common.
data, delivering near-real-time images, are a good source of information for authorities coping with the crisis during and after flooding. They provide images of a wide area, showing a clear picture of the overall extent of the flood. Part of this constellation of satellites is also Sentinel-1, a radar satellite which has the ability to show the difference between waterlogged and dry land.
“Simply comparing before and after images of the flooded region makes a rapid and authoritative damage assessment estimate possible, factoring in different land cover types to quantify the cost of the flood.” ESA, Flood Monitoring
Use-case: Floods in Central Greece
In February, Greek GIS company introduced a crisis management solution based on Sentinel Hub services where they presented the flooding in . Landslides and floods caused by led residents of several communities to and move to safer ground. Among the affected ones were also many farmers, losing entire farms as well as livestock.
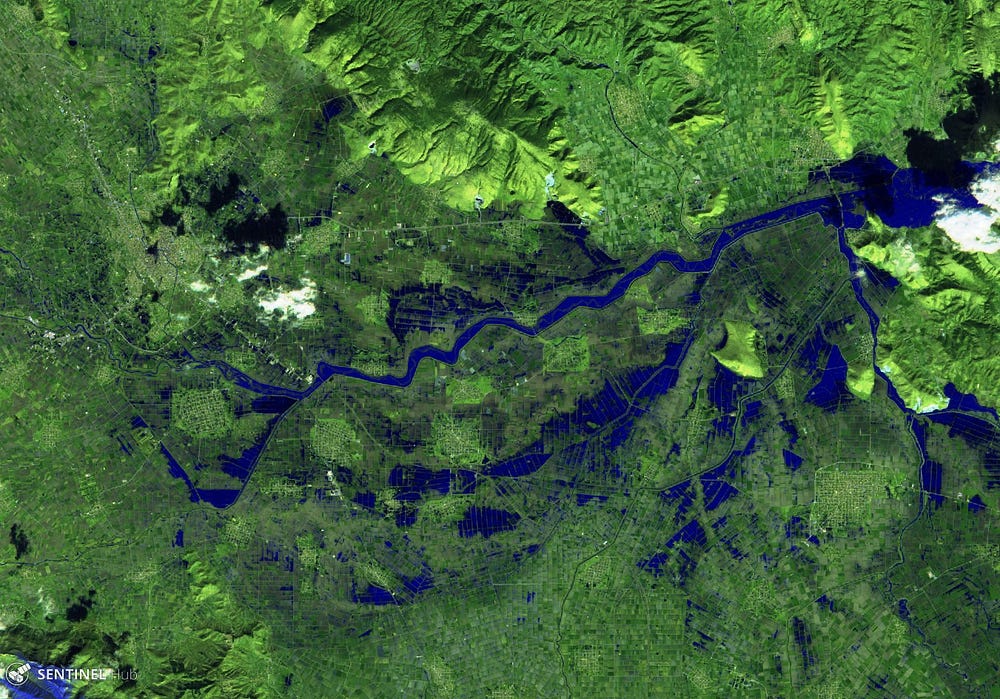
False color flooding in Greece on February 28, 2018. Explore the area on other dates in .
GET’s prototype algorithm uses SNAP for processing Sentinel-1 imagery and also uses OGC services provided by Sentinel Hub. The final datasets along with detected flood polygons are displayed dynamically via the . This consists of the complete coverage of the phenomenon, and shows the real potential of Sentinel-1 data used in crisis management.
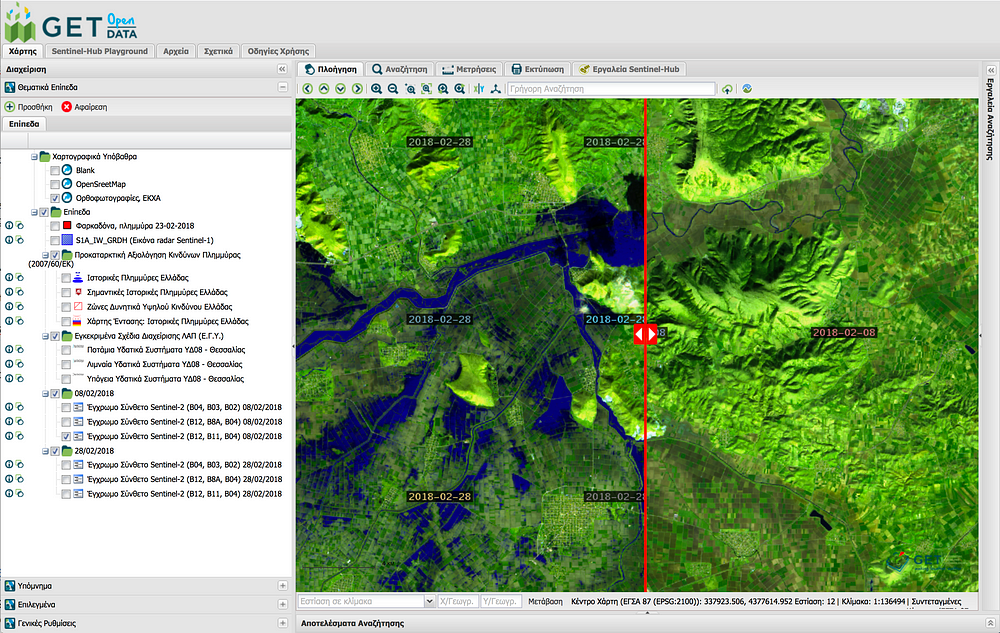
Live demo is available here:
The RGB image resulted from the stack of the calibrated and filtered sigma nought (σ0) backscatter values of the VV band from Sentinel-1 for the dates of February 11, 2018 (pre-crisis, red band) and of February 23, 2018 (crisis, green and blue band).
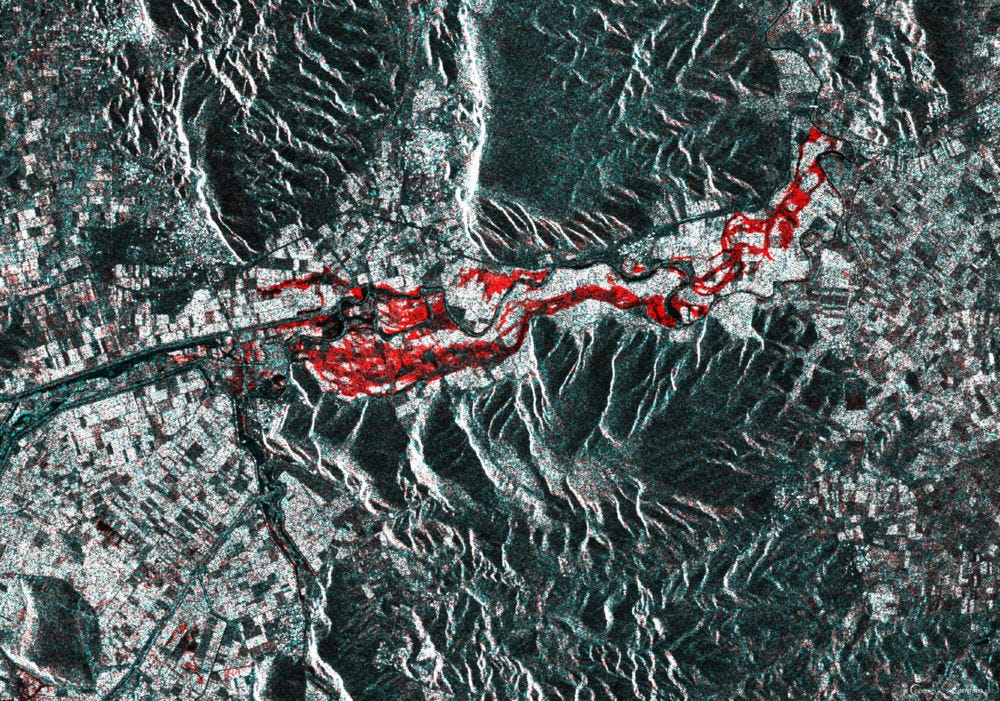
The Sentinel-1 RGB stack as described above showing the flooding on February 23, 2018.
As a result, the flooded area is depicted in red because of the high backscatter values in the pre-crisis image in contrast to the very low backscatter values in the crisis image (the flood causes specular reflectance and the radar signal is lost).
The red area highlighted the difference between flooded and non-flooded regions.
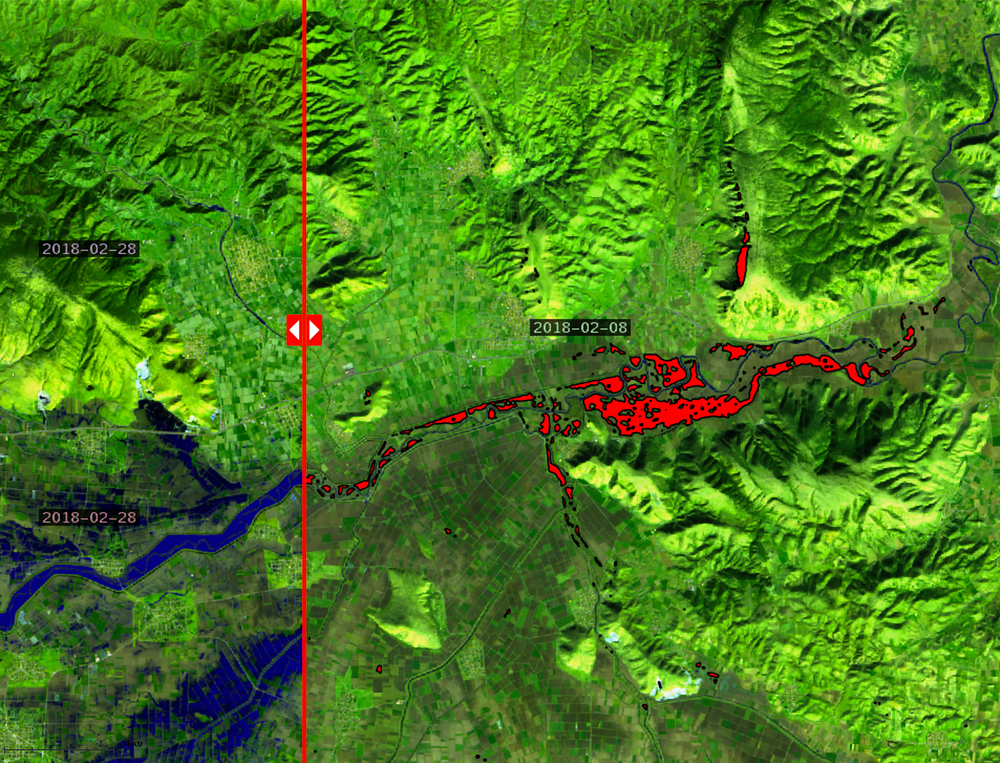
The polygons of the flood were derived by thresholding the crisis image by applying an appropriate global threshold, taking into account the histogram of the image created by the difference between Sentinel-1 acquisitions from before and during the crisis.
Tools based on timely and accurate geospatial information derived from satellite remote sensing have been successful in crisis management for years. The first operational European system for monitoring and forecasting floods, the (EFAS), has been in operation since 2012. Today's satellites provide ever higher coverage frequency and better resolution, and with their easier data accessibility we can expect more examples similar to GET’s in the future.